
Summarize the information by selecting and reporting the main features, and make comparisons where relevant.
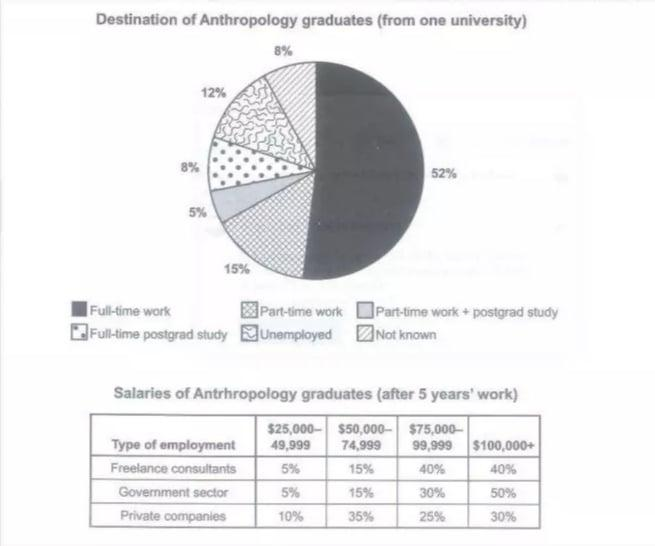
The pie chart illustrates the employment destinations of Anthropology graduates from a particular university upon completion of their undergraduate degree, while the accompanying table details their salary distribution across three employment sectors after five years of work.
Overall, the majority of graduates entered full-time employment, while a significant proportion pursued further study. Regarding salaries, the government sector offered the highest earning potential, with over half of employees earning $100,000 or more after five years.
According to the pie chart, over half of the graduates (52%) secured full-time work immediately after completing their degree, making this the most common destination. A further 15% combined part-time work with postgraduate study, while 12% engaged in part-time work only. Full-time postgraduate study accounted for 8% of graduates, and a similar proportion (8%) were unemployed. The remaining 5% had unknown employment status.
Turning to the salary table, after five years in the workforce, anthropologists working in the government sector earned the most lucrative salaries, with 50% earning $100,000 or more, and a further 30% in the $75,000–$99,999 bracket. Private companies offered a more balanced distribution, with 35% earning between $50,000 and $74,999, while 30% reached the top salary bracket. Freelance consultants showed a similar pattern to the private sector, with 40% earning $100,000+ and another 40% in the $75,000–$99,999 range, though they had a slightly higher proportion at the lowest salary level (5%) compared to private companies (10%) in the $25,000–$49,999 bracket.
It is noteworthy that none of the three sectors had employees earning below $25,000, and the government sector had the highest concentration of high earners, whereas freelance consultants showed the most polarised distribution, with equal percentages at both the upper-middle and top tiers.
Why this answer scores Band 7.5:
| Criteria | How the sample meets Band 7.5 requirements |
|---|---|
| Task Achievement | Fully addresses both the pie chart and the table. Provides a clear overview and makes relevant comparisons across all data categories. Highlights the most significant features in both visuals. |
| Coherence & Cohesion | Excellent paragraph structure: introduction → overview → pie chart details → table details → additional comparison. Uses sophisticated cohesive devices: Overall, According to, Turning to, while, whereas, with. Seamless flow between paragraphs. |
| Lexical Resource | Wide range of precise vocabulary: illustrates, upon completion, accompanying, distribution, secured, accounted for, lucrative, bracket, polarised, concentration. Avoids repetition of basic terms. Uses appropriate synonyms for "percentage" (proportion, bracket, tier). |
| Grammatical Range & Accuracy | Wide variety of complex structures: relative clauses (which accompanied...), participle phrases (making this the most common), comparative structures (similar pattern to, slightly higher proportion), and sophisticated time expressions (upon completion, after five years). Virtually no errors. |
What pushes this to Band 7.5 (compared to Band 7.0):
| Aspect | Band 7.0 | Band 7.5 (this sample) |
|---|---|---|
| Vocabulary | Good range | Wider range with precision (lucrative, polarised, concentration, bracket) |
| Data grouping | Describes each sector separately | Groups logically and identifies patterns (similar pattern, balanced distribution) |
| Comparisons | Simple comparisons | Sophisticated comparisons (whereas freelance consultants showed the most polarised distribution) |
| Grammar | Good control | Confident use of varied structures |
| Overview | Basic summary | Insightful summary with key comparisons |
Key features of Band 7.5+ Task 1 demonstrated:
1. Strong overview with both visuals:
"Overall, the majority of graduates entered full-time employment, while a significant proportion pursued further study. Regarding salaries, the government sector offered the highest earning potential, with over half of employees earning $100,000 or more after five years."
2. Sophisticated comparison across sectors:
"Freelance consultants showed a similar pattern to the private sector, with 40% earning $100,000+ and another 40% in the $75,000–$99,999 range, though they had a slightly higher proportion at the lowest salary level..."
3. Identifying exceptions and nuances:
"It is noteworthy that none of the three sectors had employees earning below $25,000, and the government sector had the highest concentration of high earners..."
4. Precise data language:
secured full-time work (not just "had jobs")
lucrative salaries (not just "good pay")
polarised distribution (not just "different")
concentration (not just "more")
5. Logical grouping:
Pie chart grouped by employment type
Table grouped by sector with comparisons across all three
Quick checklist for Band 7.5+ Task 1 (two visuals):
Clear introduction paraphrasing both visuals
Strong overview covering both visuals
Logical grouping of data (not just listing)
Accurate data reporting with appropriate approximations
Relevant comparisons within and between visuals
Identification of patterns, exceptions, and notable features
Wide range of precise vocabulary
Complex sentence structures used naturally
Virtually no grammatical errors
At least 170-190 words
Comparison: Band 6.5 vs 7.5 (same task)
| Aspect | Band 6.5 | Band 7.5 (this sample) |
|---|---|---|
| Overview | "The chart shows what graduates did and the table shows salaries." | "Overall, the majority of graduates entered full-time employment, while a significant proportion pursued further study. Regarding salaries, the government sector offered the highest earning potential..." |
| Vocabulary | show, have, different, more | illustrates, accompanied by, secured, accounted for, lucrative, bracket, polarised, concentration |
| Comparisons | "Private companies had 30% earning over $100,000." | "Private companies offered a more balanced distribution, with 35% earning between $50,000 and $74,999, while 30% reached the top salary bracket." |
| Data grouping | Describes each sector separately | Groups logically with cross-sector comparisons |
| Grammar | Simple sentences | Complex sentences with multiple clauses |
Additional tips for Band 7.5+ with two visuals:
Don't neglect either visual:
Give approximately equal coverage to both the chart and the table.
Include data from both in your overview.
Make cross-visual comparisons:
Connect the employment destinations to the salary data where relevant.
Use sector-specific vocabulary:
freelance consultants, government sector, private companies (not just "workers")
Highlight the most significant figures:
52% (full-time work) – the majority
50% earning $100,000+ in government – the top earner category
Look for patterns:
Which sector has the highest earners? (government)
Which has the most balanced distribution? (private companies)
Which shows the most polarised results? (freelance consultants)
Band Score 6The chart illustrates the career paths of recent Antropology graduates from one university. The pie chart shows the distribution of employment like full-time work, part-time work and unemployed amongst others. While the table illustrates the type of employment and the salary distribution per type of employment after working for five years. Overal working in the government sector and doing freelance consultancy earn the most while the most of the graduates work full-time. The pie chart shows the destination of the graduates. The bulk of the graduates work full-time this accounts for 52% of all the graduates. Furthermore a small group of 8% did a full-time postgrad study and a even smaller group of 5% did the same study while working part-time, thus only 13% of the graduates decided to keep on studying. 12% of the graduates did not manage to find work and are unemployed while 15% works part-time and with 8% it is unkown what they are doing currently after finishing their degree. The table shows a detailed distribution of the type of employment and the salary range of the students after working for five years. The types of employment are: Freelance consultants, Government sector wokers, workers at private companies. The salary ranges are:"25 to 49,999 thousand, 50 to 74,999 thousand, 75 to 99,999 thousand and 100 thousand plus dollars. The Freelance workers and government sector have both only 5 and 15% of the people earning 25-49,999 and 50-74,999 while freelance has equal 75-99,999 and 100+ while government have 30% earning 75-99,999 and 50% 100+. The private sector has 10% of the workers earning 25-49,999, 35% earning 50-74,99, 25% earning 75-99,999 and 30% earning 100+. The best paying sector is the government sector with freelance as a close second and the private companies as a definite loser.
Band Score 5.5The pie chart illustrates the employment Anthropology graduates from a particular university after completion their undergraduate degree, while the accompanying table details their salary distribution across three employment sector after five years work. Overall, the majority of graduate entered full time employment, while a significant proportion. Regarding the salaries of government sector offered highest earning potential, with over half of employees after five years work. According to the pie chart, full time workers covered highest proportion after completion graduates by 52%. Whereas, 15% of the part time workers from one university. In contrast, 12% of the unemployed and both not known workers and full time postgrad are the same by 8%. While 5% worked in part time and postgrad. Turning to the salary table, the government sector offered 50% salaries $100,000 or more than in after 5 years work. Whereas, 30% offered around $75,000-99,999. The financial consultants also higher salaries 40% on $100,000+ and 40% $75,000-99,999 than others. Lastly private companies gave the 35% salaries by $50,000-74,999 and 30% in $100,000+. The freelance and government first and intermediate are same proportion.
Band Score 6.5The pie chart illustrate the proportion of what Anthropology with degree from one collage did post graduation. While the table graph depicts the incomes of the same degree holders after five years of working, all the figures are given in percentages. Overall, it is evident that full time workers accounted the largest share in the destination of the graduates, whereas, full time postgrad study represented the smallest known proportion. in addition , it is noticeable that the earnings are on the same range after five years of work in every institution. Looking first at the destinations, it can be seen that full time work accounted for a bit over half of the share for 52%, followed by part time work at15%. by contrast, unemployed stood at 12%, while full time postgrad study made up only 8%. furthermore, 5% were the grads who balanced part time work + postgrad study. talking about salaries, government employees had the highest incomes with 50% over 100,000USD, while private sector earnings represented the lowest.
Band Score 6.5The pie chart and table illustrate the immediate career paths of Anthropology graduates from a single university and their respective salaries across three sectors after completing five years of employment. Overall, the vast majority of students enrolled full-time jobs, while the least prefered part-time work combined with postgraduate study. Furthermore, after five years, those working in government sectors and as freelance consultants generally earned significantly higher salaries as compared to those working with private employers. Regarding graduate destinations, over half of the students (52%) secured full-time work, while another 15% engaged in part-time employment. In contrast, only 8% pursued full-time postgraduate studies, and a mere 5% combined part-time work with further education. The remaining graduates (12%) were either unemployed or their destinations were unaccounted for (8%). Looking at the earnings five years later, the government sector proved to be the most lucrative, with exactly half of its employees earning $100,000+, and only 5% earning the lowest salary bracket ($25,000-49,999). Freelance consultants showed a similar high-earning trend, with 40% making over $100,000. Conversely, private companies paid the least; the largest proportion of their staff (35%) earned $50,000-74,999, and only 30% reached the top salary bracket.
Band Score 6The pie chart illustrates criteria of five different work Anthropology graduates have done after their graduation, while the table depicts their earning after five years of degree completion. Units for both chart and table are measured in percentage. Overall, most Anthropology graduates joined a full time work, on the other hands least of them went for full-time postgraduate study. After five years, the government sector was the domain paying maximum of them highest after five years, free consultation and government sectors were the least paying sectors for least of them. In terms of maximum students destinations, 52% of them joined full time work, however least proportion of scholars moved to do part time work along with post grad study and full fledged full time post graduate study (5 percent and 8 percent respectively). The remaining 8 percent remained unknown, in addition 12% of them stayed unemployed and rest 15% joined part time work. After five years, highest ration of students from all three sectors government, freelance consultants and private companies earned $100k+, while second most getting paid students got somewhere between 75k to around 100k. In contrast students who were earning between 50k to approximately 75k were less as compared to 25k to 50k earners.
Band Score 6The pie chart illustrates criteria of five different work Anthropology graduates have done after their graduation, while the table depicts their earning after five years of degree completion. Units for both chart and table are measured in percentage. Overall, most Anthropology graduates joined a full time work, on the other hands least of them went for full-time postgraduate study. After five years, the government sector was the domain paying maximum of them highest after five years, free consultation and government sectors were the least paying sectors for least of them. In terms of maximum students destinations, 52% of them joined full time work, however least proportion of scholars moved to do part time work along with post grad study and full fledged full time post graduate study (5 percent and 8 percent respectively). The remaining 8 percent remained unknown, in addition 12% of them stayed unemployed and rest 15% joined part time work. After five years, government sector, freelance consultants and private companies employers were earning 50%, 40% and 30% respectively with a highest package of 100k+.