
You should spend about 20 minutes on this task. Write at least 150 words.
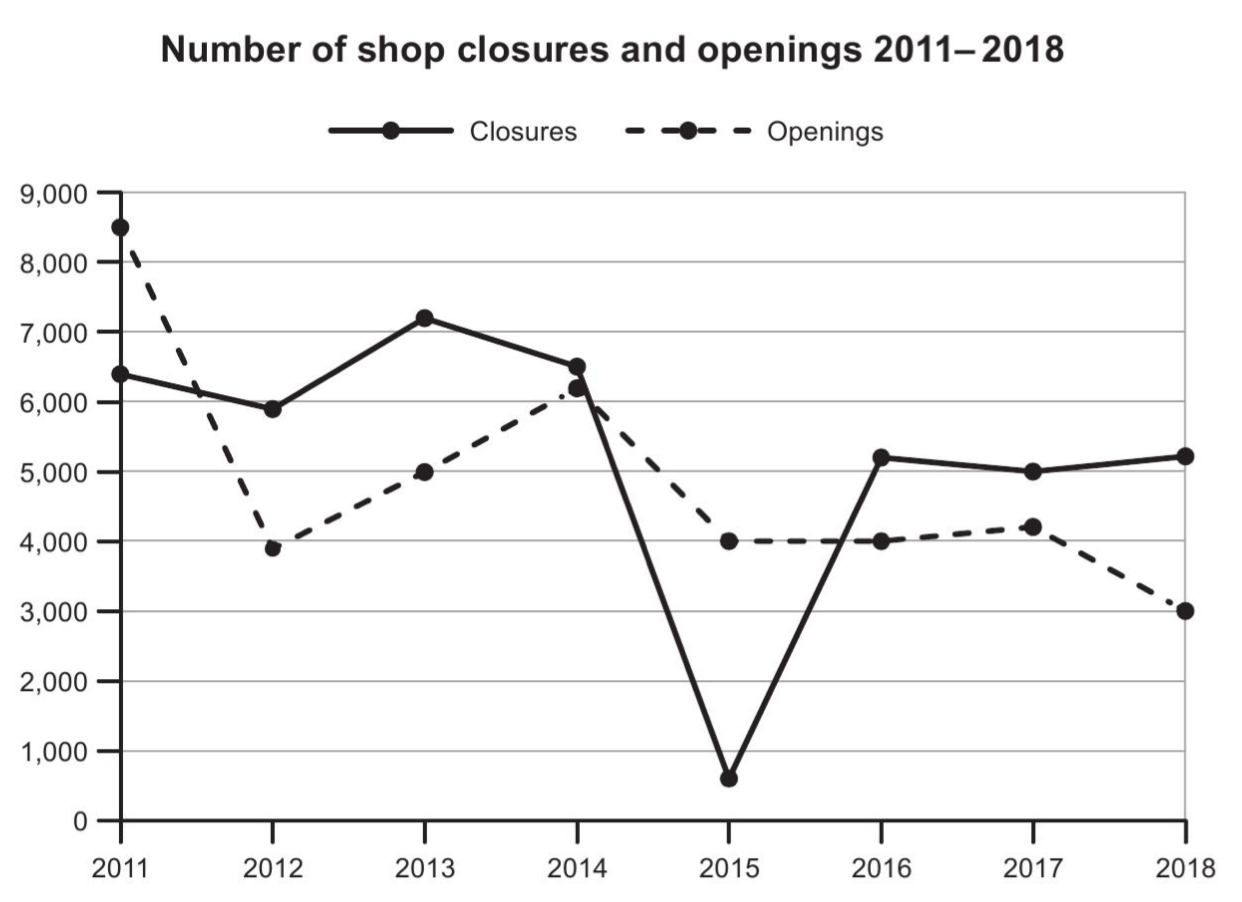
The graph below shows the number of shops that closed and the number of new shops that opened in one country between 2011 and 2018.
Summarise the information by selecting and reporting the main features, and make comparisons where relevant.
Summarise the information by selecting and reporting the main features, and make comparisons where relevant.
The line graph illustrates the annual number of shop closures and shop openings in a single country over an eight-year period, from 2011 to 2018.
Overall, it is evident that both shop closures and openings experienced a general downward trend over the period, with openings consistently lagging behind closures. Notably, the number of new shops reached its lowest point in 2015, while closures peaked in 2013, before both metrics stabilised in the final years.
In 2011, the number of shop closures stood at approximately 8,600, significantly higher than the 6,600 openings recorded that year. The following year, closures fell sharply to 5,900, while openings also declined to 3,900, representing the lowest figure for openings at that point. However, 2013 saw a dramatic reversal, with closures soaring to a peak of 7,200, while openings increased more moderately to 5,000.
From 2014 onwards, both trends exhibited notable fluctuations. Closures decreased to 6,600 in 2014 before dropping further to 4,000 in 2016, after which they stabilised at around 5,000 between 2017 and 2018. In contrast, shop openings, after reaching a high of 8,500 in 2015, plummeted to just 4,000 in 2016, a decline of more than half. Thereafter, the number of new shops levelled off at approximately 4,200 in 2017 and then fell slightly to 3,000 in 2018.
In conclusion, the data reveals a persistently challenging environment for retailers, with the number of closures exceeding openings in most years. The most striking feature was the dramatic rise in new shops in 2015, which proved short-lived, followed by a sharp decline that left the sector with fewer openings than at any other point in the period.
Band Score 5.5The graph given illustrates the number of shops closing and opening in a country in the period between 2011 and 2018. What stands out is that the graph of the number of shops that close barely fluctucates except for the years 2014, 2015 and 2016. While the graph of the amount shops opening follows a global downward trend. The shops opening in 2011 were around 8500 and decreasing significantly in 2012 with around only 4000 shops opening. The opening of shops went up for two years peaking at 2015 with around 6000 shops opening and after that point only moving downard ending with around only 3000 shops opening in 2018. The shops closing have no global trend, the levels stay around the same level year after year with minor fluctuations. This is except for the three years mentioned at the intro of the text. In 2014 around 6000 shops closed while in 2015 only around 800 shops closed. This crash then restored and the amount of shops closed in 2016 returned to normal levels with around 5000 shops closing that year and not drastically changing over the last three years of this graph Both lines follow no appearant trend, the lines seem to operate indepent of each other.
Band Score 5.5The given line graph below show the number of shops that closed and the number of new shops that opened in one country between 20011 and 2018. overall,clouser have fallenand risen dramatically throught these years, but then it became stable ,on the other hand downfall of opening weren't as dramatical as clouser ,but it also had some changes in 2011 ,there were mass of opening reachinng approximately 8500 of shops, but it this years there were also a lot of clouser reaching to mosrt 6500 .in 2012 the number of openings have fallen dremitically falling roughtly to 4000.clouser , on the hand ,were a little stable ,falling to 6000.in 2013, opening started to rise a little
Band Score 6The graph illustrates the quantity of closures and openings in one country between 2011 and 2018. Overall,closures have fallen and risen dramatically through these years,but then it became stable.On the other hand downfall of openings weren't as dramatical as closures,but it also had some changes. In 2011,there were mass of openings reaching approximately 8500 of shops,but in this year there were also a lot of closures reaching to almost 6500.In 2012,the number of openings have fallen dramatically,falling roughly to 4000.Closures,on the other hand, were a little stable,falling to 6000.In 2013,openings started to rise a little,reaching to 5000,making a progress about 1000.But closures also made a progress and reached to about 7000.In 2014,both of them were in the quite same postion,but openings were increasing,while closures were decreasing.Both of them had approximately 6000. In 2015,openings of new shops had decreased to almost 2000,reaching 4000 from 6000.On the other side,closures had a greatest downfall,falling to 900 from almost 6000.Starting from 2016,situation stayed stable,openings had just a little increase and decrease,and closures again had risen to 5000 and also stayed stable.By the 2018,3000 of new shops have opened,while roughly 5000 of shops were closed.
Band Score 4The graph compares information about the total number of shops opened and closed in an country for 2011 to 2018. Overall, it is clear that both the new shops and closed stores witnessed downward trend. While closed shops faced less decline ,number of new stored experienced much decline it its number. Commencing with the store that closed durning the period, at beginning of the period number of new opened shops was higher than closures. It started with around 8500 shops in 2011 before decreasing to 4000 in 2012. Then it raised again to above 6000 new shops by 2 years. Subsequently the number went back to 4000 in the next year and remained the same for next 3 years and plummet to 3000 stores at the 2018. By contrast, total number of closed shops was nearly 6500 in 2011 which was less than the new opening. With upward the trend the number of closures outpaced the opened shops by the following years and with gradual growth it reached its pecked in 2013 with just above 7000 in 2013. It continued its gradual trend until next year and then faced a dramatic dropped to the trend of closures and plateaued at around 5000 shops in 2015 which good for the business .By next year the country faced losses in store and more than 5000 new shops closed that year and this number remained for the next 2 years.
Band Score 5.5The line chart illustrate data about shops that establish followed by stores that closed in the same country from 2011 to 2018 Overall, it is clear that shop openings had a largest number in the beginning of the period, while shops closures reminded the lowest figure From 2011 to 2012 the number of shops that opened decline considerably, at 4000, while the shop closures decreased slightly from 6500 to 6000. In 2014 the shops were opening had grew, unlike the stores were closing. In 2015, there was a significant change in the number of shops closing, they remained the lowest number over the period around 700 shops only. By 2018, the new shops fell slightly, at 3000 shops. On the other hand, the old stores had rising moderately around 5100 stores.
Band Score 5The given line graph provides information regarding the number of shop closures and opening from 2011 to 2018. Overall, it can be seen that the lowest number of shop is closures at later year, and the highest is openings at later, otherwise openings is the peaked at beginning and the closures is lowest at beginning. In 2011, the highest is opening of shops with 8600 number of shops, followed by 2012, it was more slightly from 8600 to 4000. Then it was fluctuate from 2021 to 2015, after that it is constant in 2012 with 4056 numbers of shop. But it is slightly dropped at later with the number of shops has 3000. In the same year, the closures was lowest with 6600 number of shops, while from 2014 to 2015, it was sequentially drained with 876 numbers of shop, which is the more lowest in over a period, whereas from 2015 to 2016 it was highly built and then it remain the line at later year with 5100.
Band Score 6The line graph illustrates the number of closed and new opened shops in a country between 2011 and 2018. Overall, it can be seen that the figure for closed shops was at peak during initial year, while it fluctuated throughout the period and declined steadily in the last year. In addition, the number of new opened shops remained stable after some fluctuations, before falling down in the middle. In terms of closed shops, the number was around 6500 in 2011, which fluctuated and relatively remained stable till 2014. Afterward, it showed a significant decline at about 5000 in 2015, before increased gradually to 5000 in next year. The number was approximately stable till last year. The number of new opened shops shows a different pattern which recorded at about 8500 in the initial year, before showing a significant decline at 4000 in 2012. However, it stared increasing after that and after some fluctuations reached at 3500 in 2018.
Band Score 5.5The graph below shows the number of shops that closed and the number of new shops that opened in one country between 2011 and 2018. Let's discuss it in detail below. First, we can see the number of shop openings from 2011 to 2018. Initially in 2011, more than 8000 shops were closed down. After that the number started to get reduced by a lot by 2012 which was around 4000, and then, started to rise up in 2013 to 2014 which were 5000 and a little more than 6000 respectively. Then it started to shrink again, and it was 4000 in 2015, almost similar to 2012. After that, till the next year 2016, the number remained constant, and in the the next year 2016, it rose up a little bit which was a little over 4000, and in the last year 2018, it declined again to 3000, which was the lowest of them all. Next, we have the closures of shops from 2011 to 2018. It started with more than 6000, then the number got reduced to a bit less than 6000 and then rose again to a little over 7000 by the next year. Then, it went below 7000 closer to 6000 by 2014. Then we can see the biggest decline in number which was less than 1000 in the year 2015. And then got it's biggest jump by the following year, and it was a bit constant until 2018. All in all, it was a roller coaster, ups and down for both the number of shop closures and openings.
Band Score 6.5The line graph illustrates the number of shop closures and new shop openings in one country between 2011 and 2018. Overall, the number of new shops opened showed a downwards trend over the period, while the figure for shops closures remained relatively stable despite experiencing a dramatic delicate in 2015. Regarding shop openings, the number was highest at the beginning of the period, at approximately 8,500 in 2011. However, this figure fell sharply to around 4,000 in 2012. After that, there was a gradual recovery, with the number increasing to about 5,000 in 2013 and reaching approximately 6,000 in 2014. Despite this improvement, the figure declined again in the following years, ending at only 3,000 in 2018, which was the lowest point recorded. In terms of shop closures, the figure started at about 6,400 in 2011 and decreased slightly to just under 6,000 in 2012. it then rose significantly, reaching a peak of approximately 7,200 in 2013 before falling gradually to around 6,500 in 2014. The most noticeable change occurred in 2015, when closures dropped dramatically to only about 500. However, this was followed by a strong recovery, with the number rising to just over 5,000 in 2016 and remaining relatively stable in 2018.
Band Score 5.5The line graph illustrates data about the number of shops that closed and the number of new shops that opened in one country between 2011 and 2018. Overall, over the years, the number of shops closed and the number that opened both saw large fluctuations during the specified period of the time. However, shops closing period 2011 to 2015 expected in that period. The number of shops that closed fluctuated between almost 6000 and 7000 during the first four years of the period, after which it fell sharply to its lowest point, about 600, in 2015. However, this number increase to 5000 the following year and stayed levelled off end of the period. In 2011, 8500 shops are opening this period. After fell down in following year in half amount. Then increased in following two years, 2000 shops are opening this period. Then after one year fell down in 4000 shops and levelled off in following 3 years. Until it decreased further to 3000 in 2018.
Band Score 5.5The line graph illustrate the opening and closing of shops in the span of 7 years in one country. overall the openings of new shops and closures of shops followed the same downward trend. The incline in number of shops which closed is year 2015 took dramatic turn in year 2015 with just the closing rate of 500. where opening of shops followed a consistent downward stream. In the year 2011, near about 8500 new shops opened but the number drastically decreased in just one year to under 4000. It rose slightly in years 2013 and 2014. Whereas, the number of shops which closed were higher in 2012 and 2013. In the year 2015 both the closing and opening trend remained at similar positions near about 6200. The amount of shops which opened remained same from year 2015-2016 with slight rose in 2017. which later fell to just 3000.
Band Score 6The given graph illustrates the number of shops that closed and the number of new shops that opened in country between 2011 to 2018. Both the new opening and the closure shop's number fluctuated within the period of 2011 to 2018. The number of newly opening shop significantly decreased from the year of 2011 to 2012 and again slightly increased in the year of 2014. By then again, the number has been dropped and gradually decrease from 2014 to 2015. The number remained almost stable from 2015 to 2017. Furthermore, the number of new opening shops fall down between 2017 to 2018. The initial number of newly opened shop was between 8000 to 9000 in 2011 and after several ups and down it remained around 3000 in 2018. From the graph it can be said that the number of shop closure in 2011 and 2018 almost closed, but in between considerable amount of fluctuation has been happened. The maximum number of shop that closure has been done in between 2012 to 2013 and lower rate was in 2014 to 2015. In 2014 to 2015 number of closures has reached its peak and down to below 1000.
Band Score 6The line graph illustrate data for the number of shops that closed and opened during a period of 7 years, from 2011 to 2018. Overall, the number of shops opened peaked in 2011, whereas shops closed stood the highest in 2013. The openings have seen an up and down trend throughout this period. They reached the lowest point in 2015, while the closures were having a constant trend until a downfall happened in 2018. To get in more details, the openings peaked in 2011 at approximately 8500. On the other hand, the closures reached the highest point in 2013 peaking at around 7000 shops closed during that year. A notable trend was seen from 2012 to 2014 in the number of shops opened. They went through an upward trend, reaching 6000 after experiencing a remarkable downfall in 2012. Furthermore, the number of closures plunged in 2015 reaching approximately 900, however they saw an upward tend in 2016 reaching 5000. On the other hand, the openings from 2015 to 2017 remained stable at approximately 4000 until a downward trend occurred in 2019 reaching 3000.
Band Score 6The line graph illustrates how many shops were closed and how many new shops were opened in one country from 2011 to 2018. Overall, the ratio for new store openings and store closings experienced a fluctuating trend during the given period. In 2011, around 8500 new shops were opened, which fell drastically to 4000 in 2012. After that, the ratio of new store openings was rise steady till 2014 to just over a 6000. After a decrease in 2015, it remained almost the same in the following two years, and finished at just 3000 in 2018. Around 6500 shops were closed in 2011, which declined in 2012 to 6000. The ratio for shops closing followed a fluctuating trend till 2015, and it accounted for just 500 in 2015, which was the lowest in the given period.From 2016 to 2018, it was experienced same at 5000.
Band Score 5.5The line graph demonstrates the number of shops that opened in one nation between 2011 and 2018. The scale is in thousands. Overall it is evident that, there are lot of fluctuation seen in number of opening and closure of shops. In 2015, many shops had been closed. Whereas, large number of new shops had been opened. To commence with, opening of new hops in initial period 2011 was at its peak. Thereafter, the number of opened shops was decreased dramatically one year later in 2012 which was 4000. Additionally, it increased slightly in 2013 and 2014 which was 5000 and 6000 respectively. Subsequently ,in 2015 it was declined by 2000 which was 4000. Lastly, number of opening of shops reduced by 1000 which was 3000. To add further, with the closure of shops in beginning period in the year 2011 it was approximately 6000. After that, it slightly reduced which was 6000 exact. In the year 2013, it grow by 7000 nearly. Moreover, it increased by 500 which was 6500 in 2014. However, there were drastic decreased seen in closing of shops which was less than 1000. Later on, in 2016,2017, and 2018 it remained constant which was 5000.
Band Score 6The paragraph illustrates the proportion of the numbers of shop closures and new shops opening in the country, and how these rates change over 7 years period from 2011 to 2018. Overall, in the time between 2011 and 2015, its the time that shop closures and openings have strong fluctuations,but the closures is ìnluence more slightly than opening. In 2011, about 8,500 new shop are opened, compares with around 6,400 closures. The numbers of openings fell sharply to 4,000 in 2012 before rising to about 6,000 in 2014. After that, it remained around 4,000 until 2017 and finally dropped to 3,000 in 2018. By contrast, shop closures fell slightly from 6,500 in 2011 to 6,000 in 2012, then reached a peak of just over 7,000 in 2013. The figure dropped dramatically to below 1,000 in 2015 before recovering to around 5,000 in 2016. It stayed relatively stable and ended at just above 5,000 in 2018.
Band Score 5.5The line graph illustrates the proportion of shops closures and openings, and how these rates change in 2011-2018 period. Overall, shop closures and openings have a lot of variations between 2011 and 2018, but the percentage of shops that are opening, fluctuating more slightly than the one that are closing. Besides that, all of them simultaneously fell remarkably compared to the original figures. First and foremost, the opening shops peaked at approximately 8,500 in the first year, while the closing ones lowered than around 2,000. In 2012-2013 period, closures and openings have a similar tendency, when they not only declined slightly but also rose by 2000 in both years. Even in the central period, they nearly had the same figures, at about 6,100. Furthermore, after having the highest rate at 6,100 in 2014, closures dropped rapidly to just 500, while openings had a slight decrease, levelling of nearly 4,000 and reducing a little bit to 3,000 in final year. In contrast, closures had surged quickly from roughly 500 to 5,000 in 2016, remaining the same in the final three-year period