
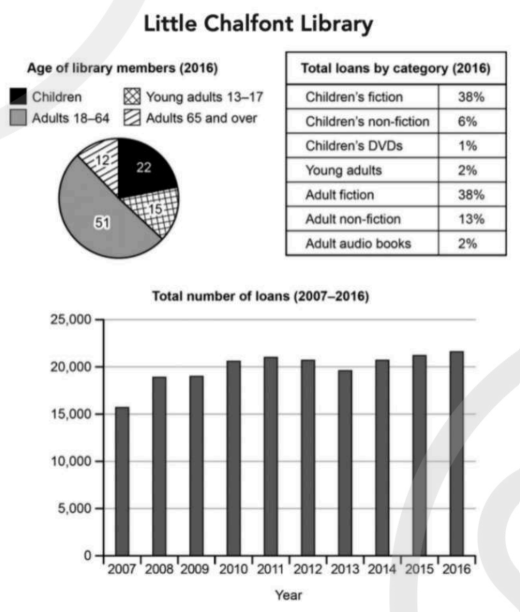
The figures present information about membership and borrowing patterns at the public library in the town of Little Chalfont.
Overall, adults constitute the largest proportion of library members. Furthermore, children’s fiction and adult fiction are by far the most frequently borrowed categories, whereas other genres are significantly less popular. Although the total number of loans fluctuated over time, there was no clear long-term trend.
In terms of membership, individuals aged 18 to 64 accounted for the highest share, at approximately 51% of all users. By contrast, elderly members represented the smallest proportion, at around 12%. The remaining members consisted of children and teenagers, both of whom made up smaller percentages compared to adults.
Regarding borrowing preferences, fiction dominated overall lending figures. Both children’s fiction and adult fiction recorded the greatest number of loans, considerably exceeding other categories.
Turning to the total number of loans between 2007 and 2016, the figure experienced several fluctuations. Despite periods of increase and decrease, the overall pattern remained relatively stable, with no significant upward or downward trend across the decade.
Band Score 6The chart shown is full of information about the public libary in a town called Little Chalfont and has three main components. The pie chart on the top left shows the distribution of memberships differentiated by age. The four different groups are children, adults 18-64 years old, young adults 13-17 years old and adults over the age of 65. The largest group of members are the adults 18-64 with a 51% share and the second biggest group are the children with 22%. The rest is almost evenly divided by the young adults and the adults 65 and older. The table on the top right discribes the percentage stake of loans of books per category. In total there are seven categories with Children and adult fiction being the most populair with both having a 38% share. The next most populair category is adult non-fiction being at 13% the rest have share of 1 to 6 percent. On the bottom of the chart is the final chart and that is a bar chart. The bar chart depicts the total number of loans through the years 2007 until 2016. The range is between fivetoushand and twentyfivethousand loans. In 2007 there were a total of just a little over fifeteenthoushand loans and that amount grew per year until 2012 and 2013 when there was a little dip in total loans. After that the loans kept increasing and in 2016 there where just a bit over twentytoushand loans.
Band Score 5.5from the above pic chart , Table, and Bar garph we can see the age of library members from 2016 , the total loans by category and the total number of loans from 2007 to 2016.This three explains the how many members are taking the loan and how much they are taking ,on which bases they are taking the most loans .This also explains the how which age members are taking the part of library. we can see in the pie chart that it discribes the age of the library members who are taking part in library membership it shows 51 percent of the membership is taken by the adults age from 18 to 64 ,22 percent are childern, 15 percent are young adults age from 13 to 17,12 percent are adults age from 65 and over .The most of the membershipd are covered by the adults when we came to table it shows the loan category in which category they have taken more loans children's fiction stands on the top of the table with 38 percent , below that adult fiction with same percent 38 then rest are taking in between 1 to 15 percent most of the loans are covered in this only children and adult's fictions the reason i think is most of the memberships are covered by this two After passing through the bargarpg of the total number of loans we can understand that year by year loans are increasing we can see in 2007 loans are 16000 when it came to 2018 loans are 19000 next year is also same then we can see increase in next three years after 2012 we can see there is decerase in loans in 2013 year after that agian we can see incraese my conclusion is most of the memberships are taken by the adults age from 18 to 64 and children so most of the loans are taken by them only
Band Score 6The given pie chart, table, and bar graph give some information about Little Chalfont Library. In general, the percantage of adult library members is 51, the children members are 22%, members who are between 13 and 17 years old is 15%, and adults 65 and over is 12%. When we look at the details, children's fiction and adult fiction became the most selected category in terms of total loans, constitiuting 38%. On the other hand, a small portion of people rented children's DVDs, young adults, and adult audio books. Secondly, total number of loans showed increasing trend throughout the all period. In 2007, while total number is approximately 15,100, this amount reached aboutt 20,800 at the end of the period. Even if the number of items which taken from library decreased in 2013, the interest in borrowing items from library inclined constantly all of the period. Also, the number of loans peaked in 2016.
Band Score 6.5The pie chart illustrates the number of the Little Chalfont library's members according to age group, while bar graph shows the total number of books which were loaned between 2007 and 2016, along with a table chart which depicts the proportion of different types of bools loans in 2016. Overall, it can be seen that more than half of library members were adults with age group 18-64, whereas elder people were less likely to become library members. In addition, children's and adult's fiction was the most preferred in 2016 to get on a loan, and all other categories were not taken much as loan. The number of loans were significantly increased throughout the period, with a few ups and downs. In terms of age of library members, the majority of members were from age group 18-64, with 51, which followed by children who were 22, and the remaining number belongs to young adults and an elderly people. In 2007, around 16000 loans were recorded, this number increased dramatically until 2011 and made up approximately 21,000. However, this number remains similar in the last of the year before a slight fall by 2000 in 2013. Library members were more interested in children's and adult's fiction accounted for 38%, which followed by adult non-fiction at 13%. Additionally, other all categories were made up less than 6%.
Band Score 5The provided pie-charts and line-graph shows data about a public library. In a particular town called little chalfont Overall, it is noticeable that in 2016 many members from little chalfont library are adults from 18 - 64 and lowest group of number of member are the adults of 65 and over while highest and lowest loan in 2007 and 2016 where as most borrowed loan are children's fiction and adult fiction consist of 38%. To begin with, most borrowed loan category is adult fiction and children's fiction at 38% almost more than half of loan category. However, average category of loan is children's non fiction and adult non fiction at 6% and 13%. Moving further, total number of loan in 2007 stood at nearly 16000 which rise gradually and reach almost 19000 in 2009. In addition, in 2010 total loan stood at about 20500 which fluctuate in between 2016 and slightly grow to almost 22000. In terms of library members in 2016 more than half 51% members of library are adult group (age 18-64) while average group of members children's consist 21%. However, lowest group members are from young adults (age 13-17 ) and adults 65 and over at 15% and 12%.
Band Score 5.5The given charts illustrate information about loans from a public library in a town called Little Chalfont from the year 2007 until 2016. It is clear to understand that the vast majority of the members that are borrowing books from the library are adults from age 18 until 64. The chart bars shows that in year 2007 the number of loans started at 15 thousand, had an increase to twenty thousand and stayed above it until 2016. The difference is the ages that loaned books from the library. Leading positions had the categories of children's fiction and adult fiction with 38%. Every other category had less than 15% loans such as, children's non-fiction and DVD's, non fiction, audio books for adults. Overall, we saw that the members to the library are increasing through time, the categories that are being borrowed are mostly children and adult fiction, the reason for that is because the members of the library are 75% that age.
Band Score 6.5These charts summarize data regarding the loaned books and the demographics of library members collected from the Little Chalfont Library. Overall, adults between the ages of eighteen and sixty-four made up the largest population of library users. Despite the large number of adult memberships, the children were more active borrowers of the library books. While adults held 51% of total memberships, children made up 22%, with adult fiction and children's fiction were borrowed at an equal rate of 38%. Adult non-fiction and audio books constituted 13% and 2%, while children's non-fiction and DVDs made up 6% and 1% respectively. The young adults section of books saw only 2% borrow rate, despite this age category making up 15% of total members. In terms of total books loaned between 2007 and 2016, the numbers fluctuated but a general upward trend was seen. The figure rose from a little over 15,000 in 2007 to above 20,000 in 2016, with some years seeing a slight dip in books loaned.